

Monitoring Linux processes, memory and networking and performance is an activity that weighs a great need for organisational efficiency and value. If the Linux operating system is well monitored, it helps IT teams in issue tracking, pointing to the root cause of issues in clear explanations from the processes running in the system.
These tools monitor the operating system on real-time bases using metrics to check CPU usage and consumption, storage, disk writing and reading, processes, system loads and computational frameworks, job execution, memory utilisation and process details, inode usage and management, cron jobs (automatic scripts that run in Linux on interval), network interfaces, hardware management, and more.
Some Linux performance monitoring tools
Note: some of these tools do not come preinstalled in Linux, you have to install them using the package manager for your Linux distro. Also, some of the commands may require root privileges, use $ sudo if you are not logged in as root.
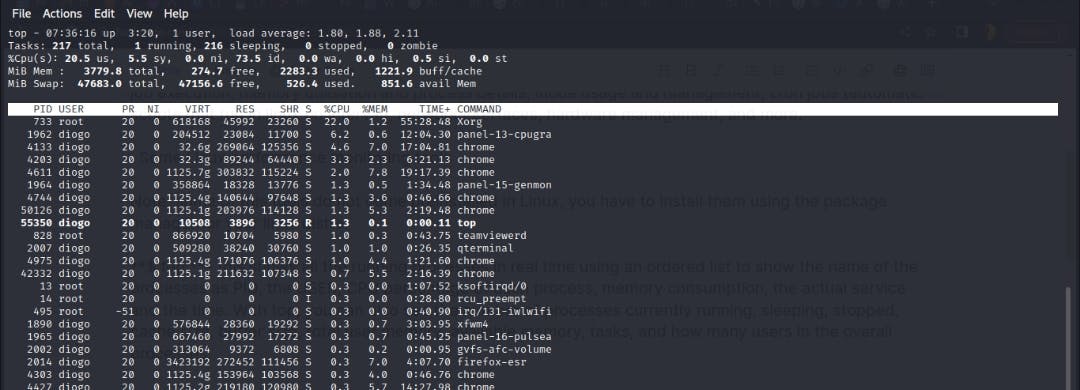
**$ top **- this shows all the running processes in real-time using an ordered list to show the name of the processes as PID, the USER, the CPU percentage of each process, memory consumption, the actual service and the time. With top, you can also see the number of processes currently running, sleeping, stopped, cache size, buffer size, total user memory, available memory, tasks, and how many users are in the overall processes.
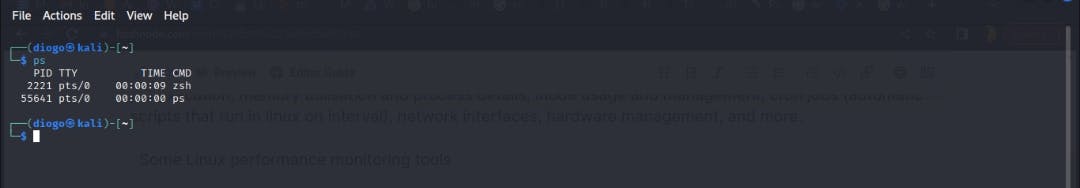
$ ps - (process status) - Linux operating system is renowned for multitasking and multi-user characteristics to also allow multiple processes to operate simultaneously without interfering with each other. The $ ps command is a tool that displays information related to the processes on the system. To view the information in a Long Output form $ ps -Al, to Print All Process On The Server $ ps ax or $ ps axu, to print the process in a tree format $ pstree.
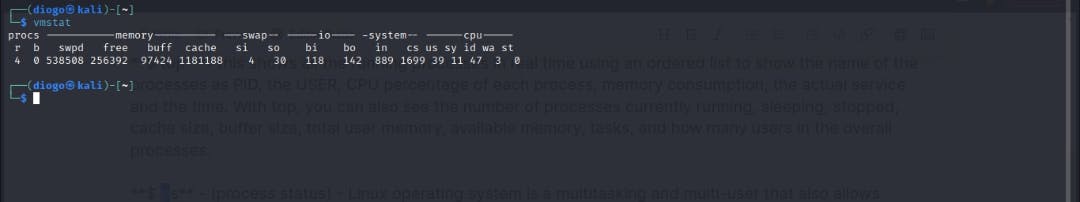
$ vmstat (virtual memory statistics) - used to display details of virtual memory, paging, kernel, system process, swap, disk, and CPU activity. to Display only Memory Utilization info, $ vmstat -m. More Information on Active and Inactive Memory Pages, $ vistas - a.
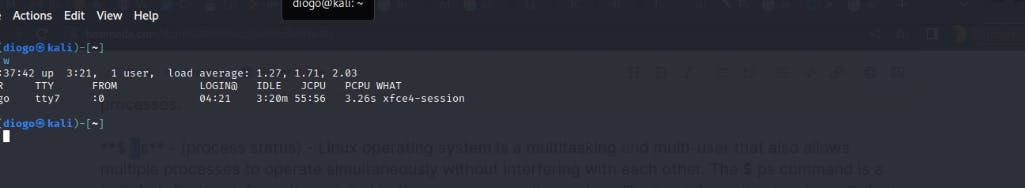
$ w - the "w" tool is used to see who is currently logged on in this operating system and what they are doing.
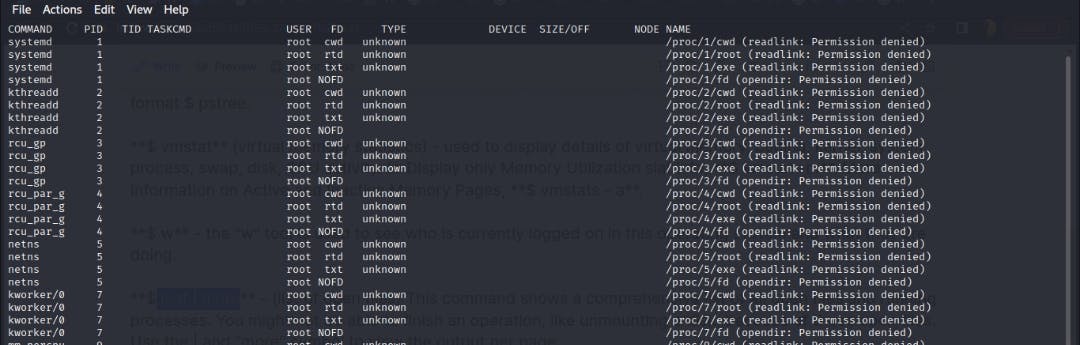
$ lsof | more - (list of open files) This command shows a comprehensive list of all open files and running processes. You might not be able to finish an operation, like unmounting a disk, because of these open files. Use the | and “more'' symbols to view the output per page.
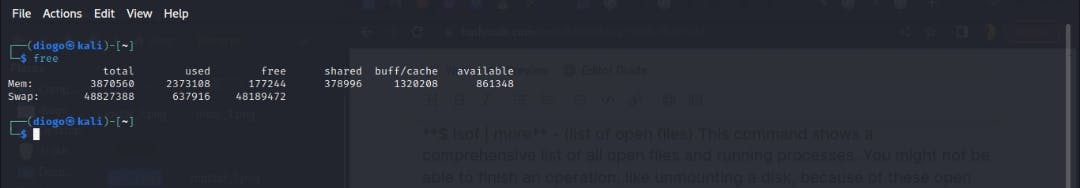
$ free - This tool displays the system's overall information free, used, and swapped physical memory as well as the kernel's used buffers.
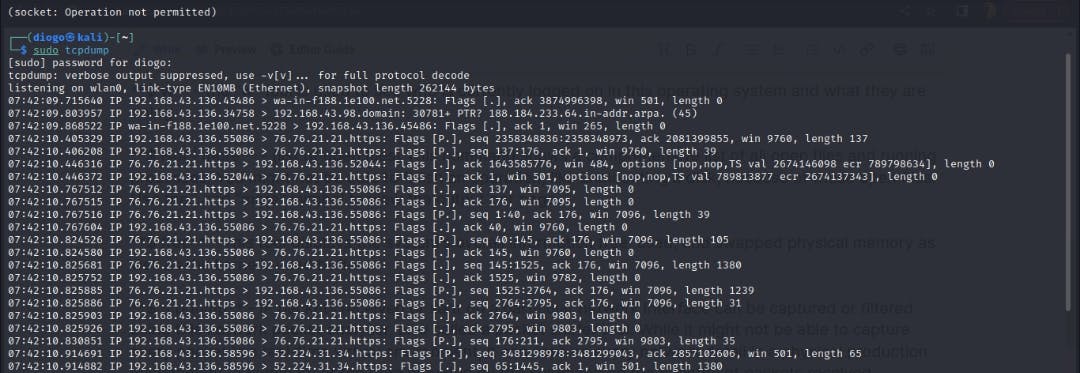
$ tcpdump - IP packets received or sent on a particular network interface can be captured or filtered using this network packet analyzer, also called a packet sniffer tool. While it might not be able to capture every packet in a real-time virtual environment, it can capture every network detail in a physical production environment. A summary of the data provided by the command on the number of packets received, packets collected, and packets lost by the kernel is also included in the tcpdump analysis.
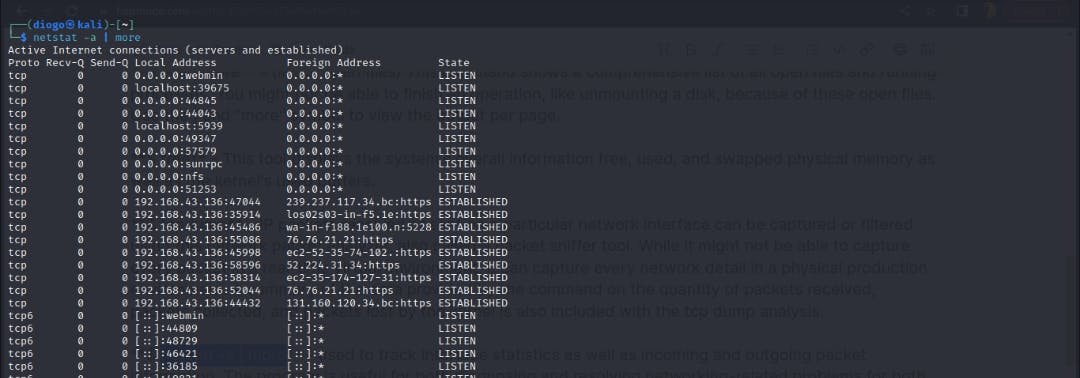
$ netstat -a | more - used to track interface statistics as well as incoming and outgoing packet information. The program is useful for both diagnosing and resolving networking-related problems for both UDP and TCP packets and active internet connections.** $ netstat** . The -a flag is to view all the results while the “more” pipe is to display them one page at a time.
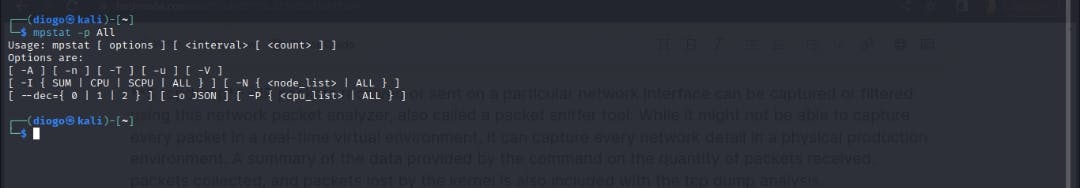
$ mpstat -p All - the mpstat tool reports activity for each available processor, with processor 0 serving as the default. This command will show the typical CPU usage for each processor.
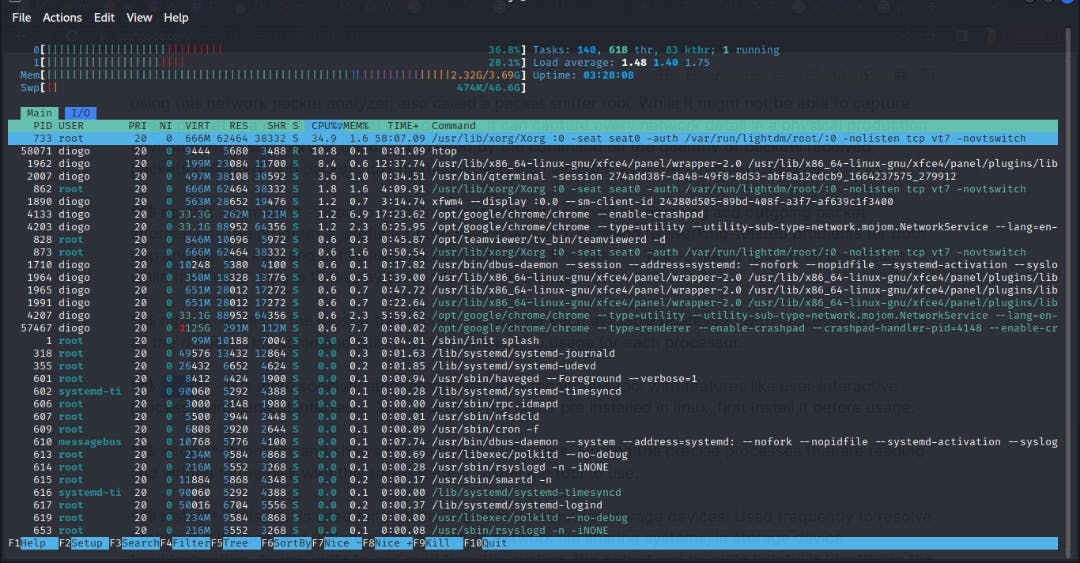
$ htop - is a more sophisticated interactive Linux monitoring tool with features like a user-interactive process management interface. This tool does not come pre-installed in Linux, first install it before usage.
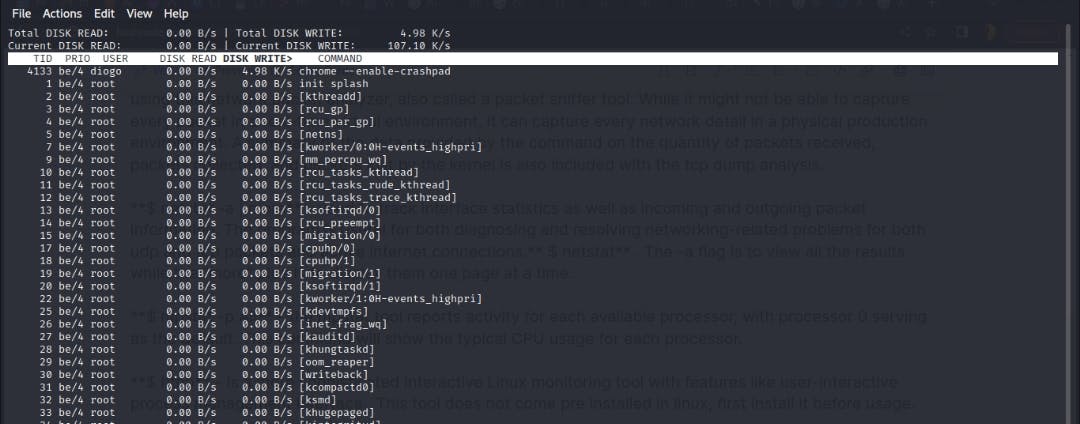
$ iotop - monitors and shows the operation of the disk. Finding the precise processes that are reading and writing to the disk with this tool is helpful. Install the tool to use.
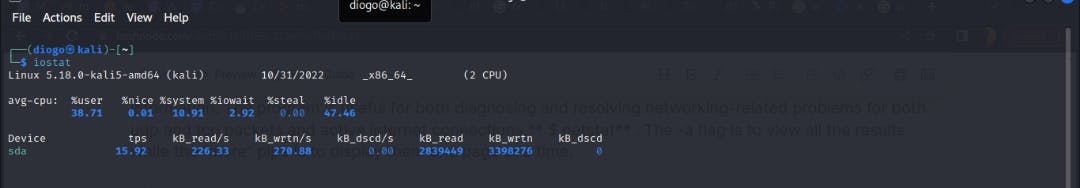
$ iostat - this tool is used for statistics input and output for storage devices. Used frequently to resolve problems with local and distant disks, as well as network file-sharing systems, in storage device troubleshooting. As you write to and read from the system, the output can be quite helpful in identifying the performance difficulties you are having with your storage disk.
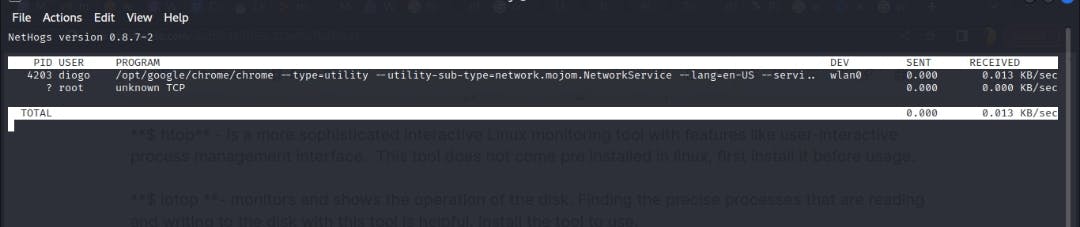
$ nethogs - In a production setting, this tool is used to monitor network bandwidth utilization, maintain track of the networking activities that are presently operating on the system and the network activity bandwidth usage based on what program is currently running on the network.
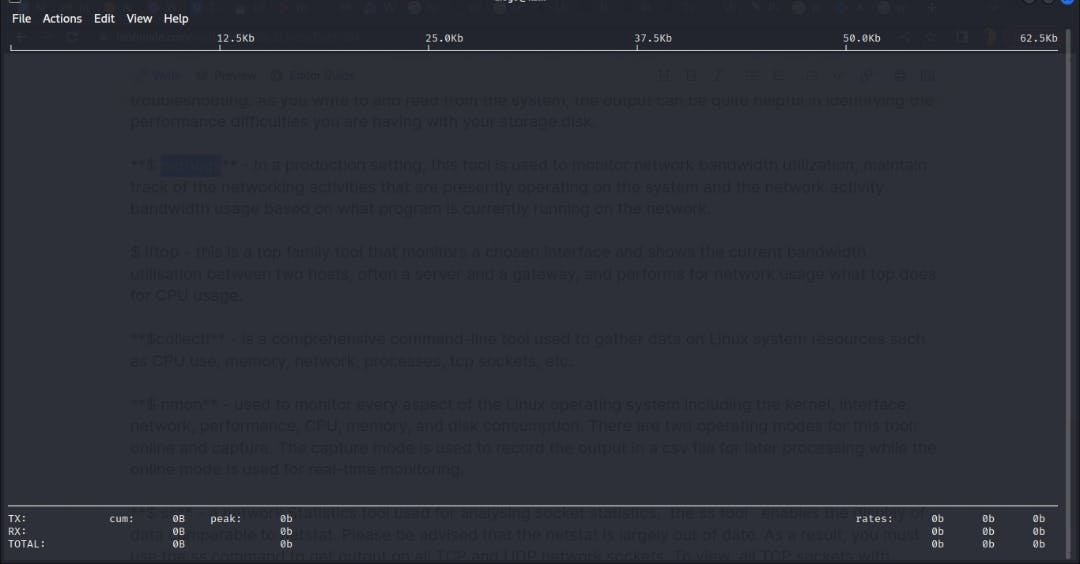
$ iftop - this is a top family tool that monitors a chosen interface and shows the current bandwidth utilisation between two hosts, often a server and a gateway, and performs for network usage what top does for CPU usage.
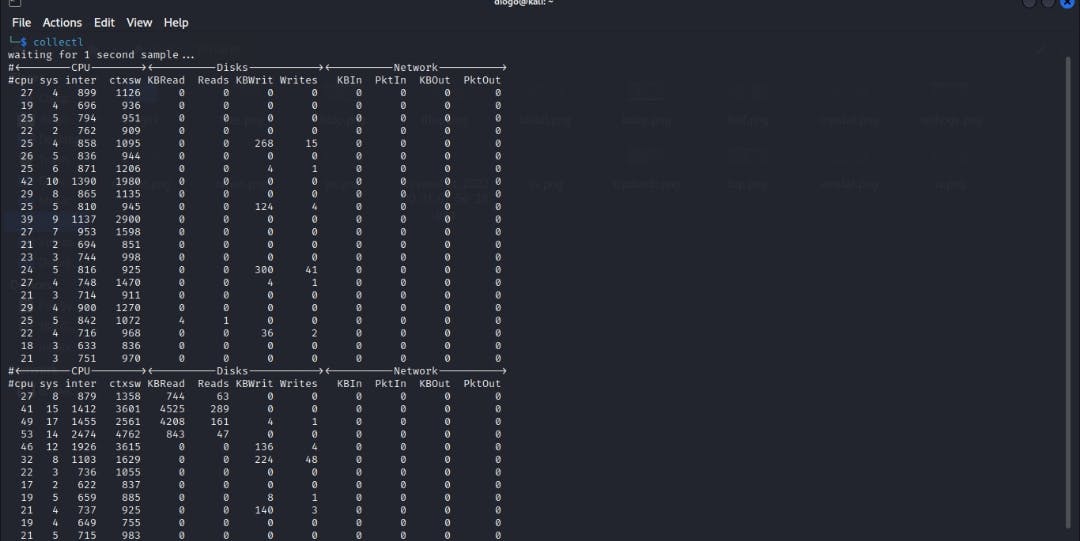
$collectl - is a comprehensive command-line tool used to gather data on Linux system resources such as CPU use, memory, network, processes, tcp sockets, etc.
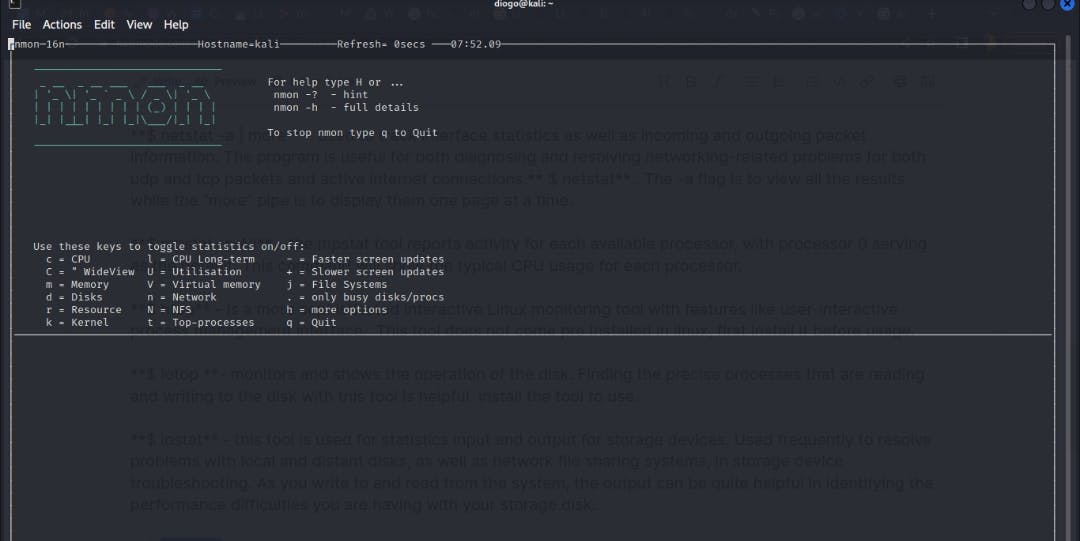
$ nmon - used to monitor every aspect of the Linux operating system including the kernel, interface, network, performance, CPU, memory, and disk consumption. There are two operating modes for this tool: online and capture. The capture mode is used to record the output in a CSV file for later processing while the online mode is used for real-time monitoring.
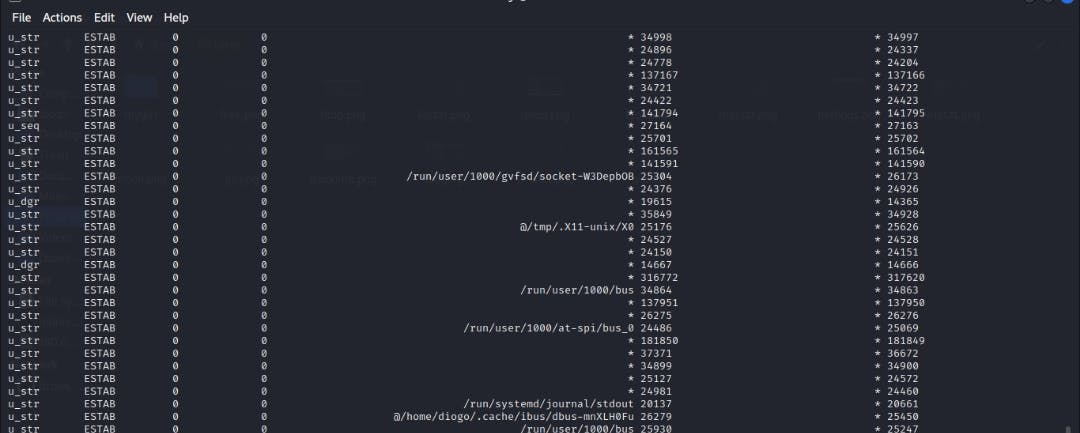
$ ss - a network Statistics tool used for analysing socket statistics, the ss tool enables the display of data comparable to netstat. Please be advised that the netstat is largely out of date. As a result, you must use the ss command to get output on all TCP and UDP network sockets. To view all TCP sockets with process the security enhanced Linux (SELinux) architecture, $ ss -t -a -Z